5 Agile Metrics for SaaS Teams: KPI Guide
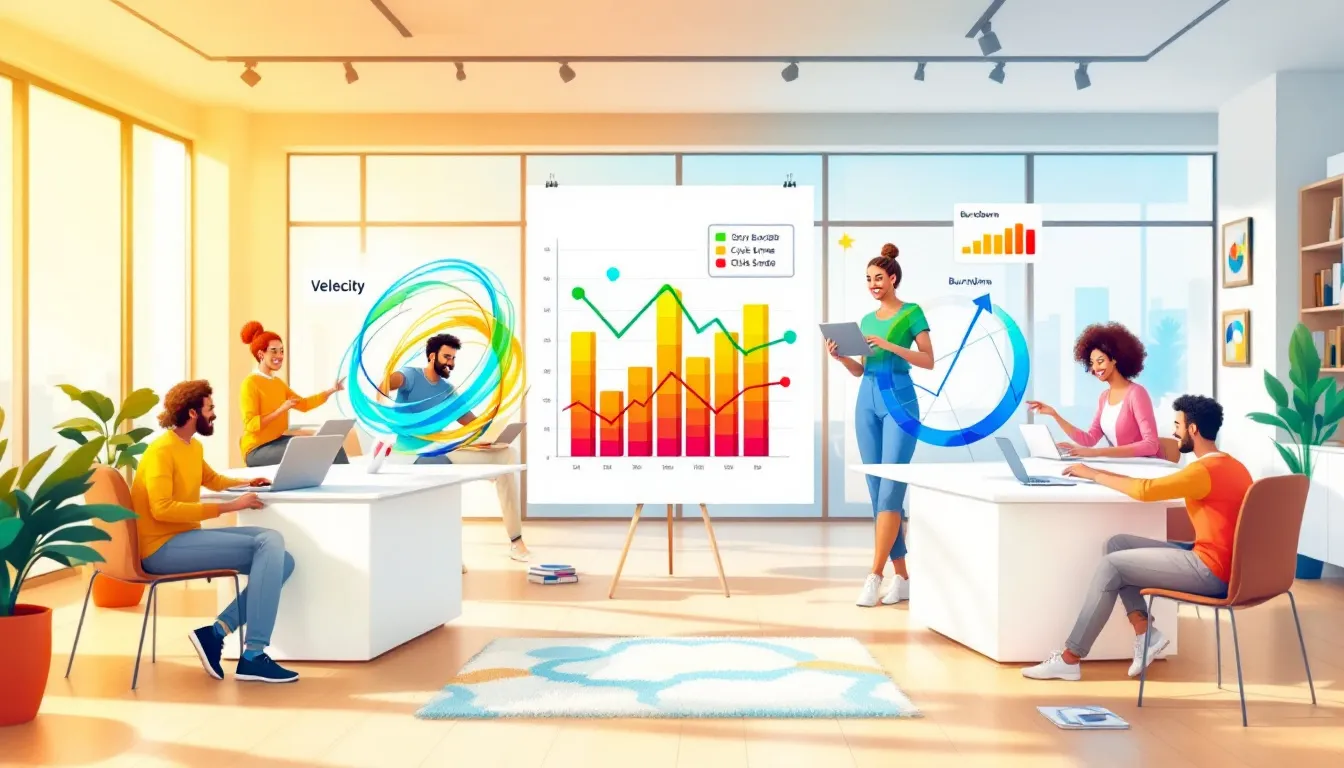
Want to boost your SaaS team's performance? Here are 5 key agile metrics to track:
- Sprint Burndown
- Velocity Tracking
- Control Charts
- Epic Burndown
- Cumulative Flow Charts
These metrics help you:
- Spot bottlenecks early
- Improve workflow
- Make data-driven decisions
Key takeaways:
- Link metrics to business goals
- Mix data with team feedback
- Update metrics as your team grows
- Focus on customer value
Remember: Metrics guide decisions, they don't make them for you.
Want to simplify integration management? Check out Endgrate - it offers 100+ integrations through a single API, potentially boosting your team's velocity by 20-30%.
Related video from YouTube
Sprint Burndown
Sprint Burndown charts are like a GPS for your project. They show you where you are and how far you've got to go.
Why Use Sprint Burndown
Sprint Burndown charts help you spot delays before they mess up your sprint. They give you a quick view of your team's progress, helping you:
- See work completion in real-time
- Find bottlenecks early
- Keep your team on track and motivated
Josh Fechter, Co-founder of Product HQ, says:
"Burndown charts provide insight into the velocity of the project, which is a key metric for determining the requirements and total effort necessary for completing user stories during each iteration."
Setting Up Sprint Burndown
Creating a Sprint Burndown chart isn't hard. Here's how:
- Start with your sprint backlog and total story points
- Draw the ideal work remaining line (it should go down to zero by sprint end)
- Update daily with actual work remaining
- Watch your team's progress unfold
Pro tip: Use a tool that does this for you. Many Agile project tools have built-in Burndown charts.
Common Problems
Even great teams can have issues with Sprint Burndowns. Here are some typical problems:
- Wrong estimates: If your initial story point guesses are off, your Burndown will be too
- Scope creep: Adding work mid-sprint can make your Burndown look weird
- Missed updates: Forgetting to update daily can cause misleading jumps or drops
Tips for Better Results
Want to make your Sprint Burndown work better? Try these:
1. Keep tasks small
Aim for tasks that take a day or less. This gives you more accurate daily updates.
2. Update every day
Make updating the Burndown part of your daily stand-up.
3. Use it to start talks
If the chart shows you're behind, use it to discuss obstacles and solutions.
4. Skip weekends
This can make your chart look cleaner and progress more even.
What Not to Do
Avoid these mistakes to keep your Sprint Burndown on track:
- Don't use it alone. Mix it with other metrics for a better view
- Don't worry too much about the ideal line. Some ups and downs are normal
- Don't use it to micromanage. It's a tool for the team, not a way to boss people around
Velocity Tracking
Velocity tracking helps SaaS teams measure output and plan sprints. It's not just about story points - it's about understanding team capacity and improving planning.
Measuring Team Output
Velocity is your team's speedometer. It shows how much work your team can deliver in a sprint, based on task effort or complexity. Here's why it's useful:
- It helps forecast future sprint workloads
- It improves resource allocation
- It provides data for timeline discussions
Velocity is a team metric, not an individual one. Focus on collective performance to boost collaboration.
How to Calculate Sprint Velocity
Calculating sprint velocity is simple:
- Give each task a story point value
- Count completed points at sprint's end
- Average points over a few sprints
For example: If your team finishes 50 points in sprint 1, 40 in sprint 2, and 60 in sprint 3, your average velocity is 50 points per sprint.
Pro tip: Use a range like 40-60 points to account for performance variations.
Understanding Velocity Patterns
Velocity patterns can reveal team performance insights:
- Steady increase: Good Scrum teams often see about 10% increase per sprint
- Big swings: Might mean your tasks are too big
- Sudden drops: Could signal external issues or team problems
Use these patterns to fuel sprint retrospective discussions. What's causing changes? How can you improve?
Using Velocity in Sprint Planning
Velocity helps with sprint planning. Here's how:
- Use average velocity to estimate next sprint's workload
- Arrange your backlog based on priority and team capacity
- Set realistic expectations with stakeholders
Tim Metz from Animalz says:
"Velocity helps plan your Sprints."
But remember: Velocity is for planning, not comparing teams or judging individuals.
Watch out: Don't chase higher velocity at the cost of quality. Focus on value, not just numbers.
Control Charts
Control charts help SaaS teams boost productivity and optimize workflow. They show how stable your process is over time, making it easy to spot trends and make smart choices based on data.
Time Tracking Basics
Control charts track how long it takes to finish work items. Here's how to start:
- Pick your metrics: Focus on cycle time (from start to finish) or lead time (from issue logged to done).
- Get your data: Collect at least 20 past data points to set initial control limits.
- Make your chart: Use dates on the X-axis and time on the Y-axis.
Jira's control chart uses green dots for issues. Bigger dots mean more completed items. This makes it simple to see patterns quickly.
Tracking Work Progress
Control charts really shine when you're keeping an eye on how work moves through different stages. Here's what to look for:
- The average line (red in Jira) shows the typical time to finish tasks.
- A rolling average (blue line) shows recent performance trends.
- The shaded area shows how much your process varies.
By looking at these parts, you can spot bottlenecks or inefficiencies fast. If you see a sudden jump in completion times, it might mean there's a problem in your process that needs fixing.
Measuring Team Progress
Control charts are great for comparing how your team performs over time. Here's how to use them well:
- Set your limits: Make upper and lower boundaries based on your data.
- Watch for outliers: Points outside these limits might need a closer look.
- Find patterns: Steady up or down trends can show changes in your process.
ZenHub, a project management tool, says: "Understanding how long it takes to close issues or your velocity helps you predict how quickly you'll finish upcoming issues." This predictability is key for planning sprints and assigning resources.
sbb-itb-96038d7
Epic Burndown
Epic Burndown charts help SaaS teams track big features over time. They show you if you're on track or need to adjust your plans.
Feature Progress Tracking
Epic Burndown charts make it easy to see how your feature development is going. They show work done vs. work left, giving you a quick look at your team's speed.
Here's how to use Epic Burndown for tracking:
- Split your epic into smaller tasks
- Estimate each task's effort
- Make a chart with total effort (y-axis) and time (x-axis)
- Update it as you finish tasks
This gives you a clear picture of your progress. You'll know right away if you're on schedule or falling behind.
"Epic burndown gives a helping hand. This metric is a powerful tool that can shed light on epics and provide valuable insights into your progress."
Managing Project Size
Epic Burndown charts help you adjust your project based on real progress. They let you make smart choices about adding or removing work.
How to use Epic Burndown for project size:
- Watch the slope of your burndown line. If it's steeper than expected, you might have underestimated the work.
- Look for sudden changes in remaining work. These could mean scope changes or wrong estimates.
- Use the chart to guess when you'll finish. If it's too far out, think about cutting some features.
Remember, delivering value is the goal, not just finishing tasks. If your chart shows you might miss deadlines, it's time to rethink your priorities.
Finding Problems Early
Epic Burndown charts are great at spotting issues before they become big problems. They're like an early warning system for your project.
Watch out for these warning signs:
- Flat lines: This could mean blocked tasks or not enough resources.
- Upward trends: More work appearing could be scope creep or underestimation.
- Erratic patterns: Big ups and downs might mean inconsistent task breakdowns or estimation issues.
Don't worry if you see these. Use them to get better. Talk about the problems in your team meetings and come up with solutions together.
"Burndown charts are simple graphical tools that give everyone a clear view of how the project is progressing."
Cumulative Flow Charts
Cumulative Flow Diagrams (CFDs) help SaaS teams see and fix workflow issues. They show your project's progress at a glance, making it easy to spot problems and work faster.
Checking Work Flow
CFDs show how work moves through your process. Here's how to use them:
- Get the basics
CFDs use colored bands for work stages (like "To Do", "In Progress", "Done"). The up-and-down shows task numbers, left-to-right shows time.
- Look for parallel lines
Good CFDs have bands that grow side-by-side. This means your work is steady and predictable. Agile Alex says:
"A good cumulative flow diagram shows you if your workflow is stable and where the problems are."
- Watch the 'Done' band
The bottom band should keep growing. If it's not, your team might be stuck or overloaded.
- Use in team talks
CFDs are great for sprint reviews. They show how your team did over time, which can lead to good talks about getting better.
Finding Work Slowdowns
CFDs are great at showing workflow problems. Here's how to spot and fix common issues:
- Watch for fat bands
If a band gets fat fast, that's bad. It means work is piling up there.
- Fix pile-ups quick
When you see a fat band:
- Find out which stage is slow
- Figure out why work is stuck there
- Change your process or move people around to fix it
- Beware of skinny bands
A band that suddenly gets thin can mean that stage is running out of work. This could cause problems later.
- Look for flat lines
A flat line means no new work is coming into that stage. This could mean a bigger problem earlier in your process.
- Use the bottleneck theory
When you find a slowdown:
- Spot the bottleneck
- Make the most of what you have there
- Change other parts to help
- Add more resources if needed
- Keep checking for new bottlenecks
Real-world win: Boa Vista, a big Brazilian finance company, used CFDs well. By looking at their CFDs often, they found and fixed workflow problems. This made their projects faster and more steady.
CFDs aren't just pretty pictures. They're tools to help you keep getting better. Olga Gierszal, who knows a lot about software, says:
"A cumulative flow diagram helps teams find bottlenecks and work better."
How to Get Started
Want to get your SaaS team using agile metrics? It's not as tough as you might think. Here's a no-nonsense guide to help you set up and use these powerful tools.
Choosing the Right Tools
Picking tools for agile metrics is crucial. Look for ones that:
- Work well with what you're already using
- Can handle your team's growth
- Let different people see what they need
Jira Software is a hit with many SaaS teams. It shows Sprint Burndowns, Velocity, and Cumulative Flow all in one spot. ClickUp is another option, with an easy-to-use interface and customizable views.
Remember: The best tool isn't always the fanciest. It's the one your team will actually use.
Getting Good Data
You need solid data for your metrics to mean anything. Here's how to get it:
- Make sure everyone knows what each metric means
- Teach your team to enter data the same way
- Check your data regularly to make sure it's accurate
Atlassian, the folks behind Jira, put it this way:
"Clean, consistent data is the foundation of meaningful metrics. Without it, you're just guessing."
When to Check Metrics
Timing matters when looking at your agile metrics. Try this schedule:
- Every day: Quick look at Sprint Burndown
- Every week: Team checks Velocity and Control Charts
- Every month: Deep dive into Epic Burndown and Cumulative Flow
The point is to use these metrics to get better, not to watch every move. Mike Cohn, who started Mountain Goat Software, says:
"Metrics should inform decisions, not make them for you."
Making Regular Updates
Your agile metrics aren't set in stone. Keep them useful by:
- Looking them over after each sprint
- Asking your team which ones help the most
- Being ready to drop metrics that aren't helping
Spotify, known for being agile, often changes its metrics. They found that looking at team health alongside performance led to better results overall.
Getting Teams on Board
Even great metrics are useless if your team doesn't use them. Here's how to get everyone excited:
- Explain why each metric matters
- Show how metrics can make work easier
- Celebrate wins that the metrics help achieve
Dan Radigan, Atlassian's Agile Coach, suggests:
"Make metrics a team effort. When everyone contributes to choosing and tracking metrics, they're more likely to use them."
Endgrate for Agile Teams
Agile SaaS teams often struggle with integration management. Endgrate offers a solution that can transform how you handle integrations and boost your agile performance.
Easier Integration Management
Endgrate takes the headache out of complex integrations. Here's how:
Single API, Multiple Integrations
Endgrate gives you access to over 100 third-party integrations through one API. This means:
- Less time wrangling integrations
- Faster sprint completions
- Better velocity metrics
You can tailor Endgrate's data models to fit your needs. This helps:
- Reduce scope creep
- Keep your projects on track
Real-Time Metric Tracking
Endgrate centralizes your integrations, making it easier to track KPIs across your tech stack. The result?
- More accurate sprint burndowns
- Better control charts
Better Resource Use
Endgrate doesn't just simplify integrations. It helps your whole team work smarter:
Accelerated Development
By cutting out the need to build and maintain multiple integrations, Endgrate frees up your developers. This can lead to:
- Higher velocity
- Better sprint completion rates
Optimized Resource Allocation
With Endgrate, you'll spend less time managing integrations. This means:
- More effective resource allocation
- Smoother workflows (as shown in cumulative flow diagrams)
- Fewer bottlenecks
Enhanced Productivity
Endgrate's streamlined approach means less context-switching for your team. This can lead to:
- Improved focus
- Higher productivity
- Potential 20-30% boost in velocity metrics
In short, Endgrate can help your agile team work faster, smarter, and more efficiently. By simplifying integrations, it lets you focus on what really matters: delivering value to your customers.
Conclusion
Picking the right agile metrics is key for SaaS teams looking to boost their development and deliver value. By zeroing in on metrics that match business goals, teams can get a clear picture of their productivity, quality, and overall performance.
We've covered five crucial agile metrics for SaaS teams:
- Sprint Burndown
- Velocity Tracking
- Control Charts
- Epic Burndown
- Cumulative Flow Charts
Each of these gives teams a unique lens to spot bottlenecks, smooth out workflows, and make smart, data-backed choices.
But here's the thing: using agile metrics isn't just about piling up data. It's about driving real improvements. Dan Radigan from Atlassian puts it well:
"Agile metrics and KPIs are just one part of building a team's culture. They give quantitative insight into the team's performance and provide measurable goals for the team."
To get the most out of these metrics:
1. Link metrics to business goals
Make sure your chosen metrics directly support what your company wants to achieve. They should give you actionable insights, not just numbers.
2. Mix hard data with team feedback
While metrics give you solid data, don't forget to listen to your team during retrospectives. This combo builds trust and ups product quality.
3. Keep your metrics fresh
As your team grows and changes, so should your metrics. Regularly check if your KPIs are still doing the job.
4. Keep your eye on the prize: value for customers
At the end of the day, your agile practices should be judged by the value they bring to customers. Use metrics to support this goal, not as the goal itself.
Related posts

Ready to get started?
